The imported infections among foreign travelers in China: an observational study - Globalization and Health - Globalization and Health
Demographic characteristics and infection types of the imported diseases
During 2014–2018, a total of 17,189 travelers with 58 imported infectious diseases were confirmed out of totally 140,210.30 thousand person-times foreign travelers, with an overall incidence of 122.59 per million, which comprised of 14,452 cases reported from CISS and 2,737 reported from NNIDRS (Figure S2). Travelers of male gender, aged 15–44 years, those originating from Asian countries have accounted for a higher proportion of travel related cases than their counterparts (all p < 0.001) (Table 1).
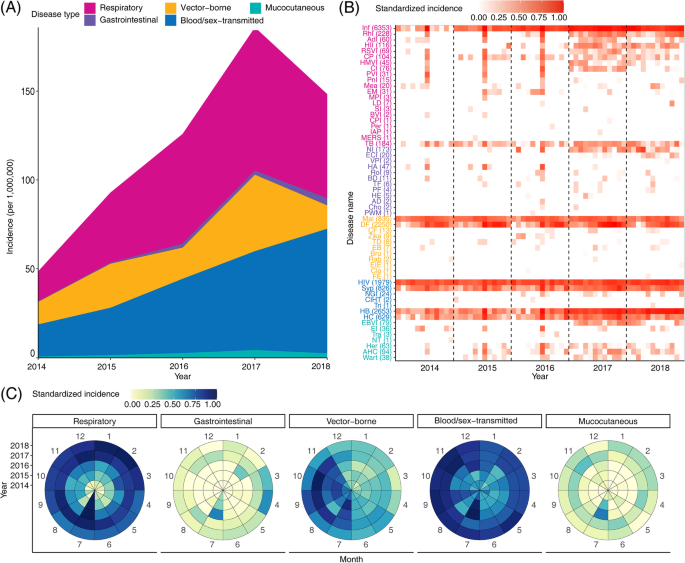
The respiratory infection (RI) had the highest average incidence of 24.96 per million and showed ascending tendency over the 5 study years (Fig. 1A). Influenza was most frequently seen among all types of respiratory diseases determined from the travelers, with an extraordinarily high level in the year 2017 and 2018 (Fig. 1B). Blood/sex-transmitted infection (BSTI) was the second most frequent disease with a consistently increasing incidence from 18.10 per million in 2014 to 70.13 per million in 2018. HIV infection, syphilis, hepatitis B and hepatitis C were among the most frequent diagnosis, with incidence rates of 14.12, 5.89, 18.92 and 4.48 per million, respectively (Fig. 1B). When data from two reporting systems were separately analyzed, respiratory infection and vector-borne diseases were the most common syndrome classification from CISS and NNIDRS, respectively (Figure S5).

Annual trends and seasonal pattern of imported infections among foreign travelers in the mainland of China, 2014‒2018. A Changes in the annual incidence rate of five infection types over time. B Changes in the monthly standardized incidence rate of 58 imported infectious diseases over time. C Changes in the monthly standardized incidence rate of five infection types over time
The spectrum of imported infection
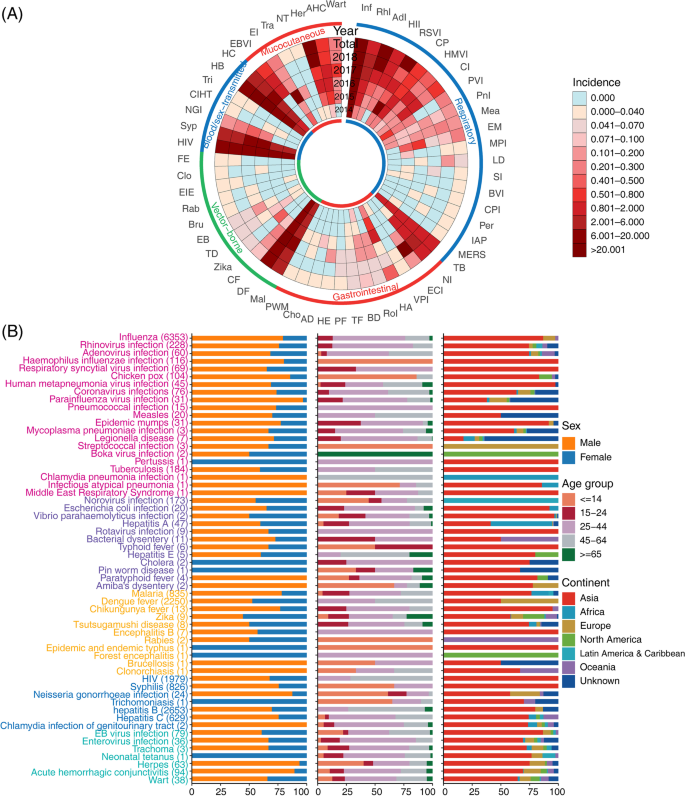
Totally 58 imported infectious diseases were diagnosed among 17,189 travelers (Fig. 2). The 10 most common infections were influenza (with a proportion of 36.96%), followed by hepatitis B (15.43%), dengue fever (13.09%), HIV (11.51%), malaria (4.86%), syphilis (4.81%), hepatitis C (3.66%), rhinovirus infection (1.33%), and tuberculosis (1.07%), and norovirus infection (1.01%), which collectively had taken 93.72% (16,110/17,189) of the confirmed diagnosis. Their annual incidence kept increasing during the study period, especially for HIV infection, hepatitis B and norovirus infection (Fig. 3A).

The standardized incidence rate of imported infection from foreign travelers with foreign nationality in 6 continents and 23 selected countries in China. Notes: Inf: Influenza; RhI: Rhinovirus infection; AdI: Adenovirus infection; HII: Haemophilus influenzae infection; RSVI: Respiratory syncytial virus infection; CP: Chicken pox; HMVI: Human metapneumonia virus infection; CI: Coronavirus infections; PVI: Parainfluenza virus infection; PnI: Pneumococcal infection; Mea: Measles; EM: Epidemic mumps; MPI: Mycoplasma pneumoniae infection; LD: Legionella disease; SI: Streptococcal infection; BVI: Boka virus infection; CPI: Chlamydia pneumonia infection; Per: Pertussis; IAP: Infectious atypical pneumonia; MERS: Middle East Respiratory Syndrome; TB: Tuberculosis; NI: Norovirus infection; ECI: Escherichia coli infection; VPI: Vibrio parahaemolyticus infection; HA: Hepatitis A; RoI: Rotavirus infection; BD: Bacterial dysentery; TF: Typhoid fever; PF: Paratyphoid fever; HE: Hepatitis E; AD: Amiba's dysentery; Cho: Cholera; PWM: Pin worm disease; Mal: Malaria; DF: Dengue fever; CF: Chikungunya fever; TD: Tsutsugamushi disease; EB: Encephalitis B; Bru: Brucellosis; Rab: Rabies; EIE: Epidemic and endemic typhus; Clo: Clonorchiasis; FE: Forest encephalitis; Syp: Syphilis; NGI: Neisseria gonorrhoeae infection; CIHT: Chlamydia infection of genitourinary tract; Tri: Trichomoniasis; HB: Hepatitis B; HC: Hepatitis C; EBVI: EB virus infection; EI: Enterovirus infection; Tra: Trachoma; NT: Neonatal tetanus; Her: Herpes; AHC: Acute hemorrhagic conjunctivitis; AS: Asia; KP: Dem. Rep. Korea; IN: India; ID: Indonesia; JP: Japan; KR: Korea; MY: Malaysia; MN: Mongolia; PH: Philippines; SG: Singapore; TH: Thailand; EU: Europe; FR: France; DE: Germany; IT: Italy; NL: Netherlands; PT: Portugal; RU: Russia; SE: Sweden; CH: Switzerland; GB: United Kingdom; NA: North America; CA: Canada; US: United States; OA: Oceania; AU: Australia; NZ: New Zealand; LA: Latin America; AF: Africa

The spectrum of imported infections in foreign travelers with foreign nationality in the mainland of China, 2014–2018. A The annual incidence rate of 58 imported infectious diseases. B Sex, age, and original continent distribution of 58 different imported infections. Notes: Inf: Influenza; RhI: Rhinovirus infection; AdI: Adenovirus infection; HII: Haemophilus influenzae infection; RSVI: Respiratory syncytial virus infection; CP: Chicken pox; HMVI: Human metapneumonia virus infection; CI: Coronavirus infections; PVI: Parainfluenza virus infection; PnI: Pneumococcal infection; Mea: Measles; EM: Epidemic mumps; MPI: Mycoplasma pneumoniae infection; LD: Legionella disease; SI: Streptococcal infection; BVI: Boka virus infection; CPI: Chlamydia pneumonia infection; Per: Pertussis; IAP: Infectious atypical pneumonia; MERS: Middle East Respiratory Syndrome; TB: Tuberculosis; NI: Norovirus infection; ECI: Escherichia coli infection; VPI: Vibrio parahaemolyticus infection; HA: Hepatitis A; RoI: Rotavirus infection; BD: Bacterial dysentery; TF: Typhoid fever; PF: Paratyphoid fever; HE: Hepatitis E; AD: Amiba's dysentery; Cho: Cholera; PWM: Pin worm disease; Mal: Malaria; DF: Dengue fever; CF: Chikungunya fever; TD: Tsutsugamushi disease; EB: Encephalitis B; Bru: Brucellosis; Rab: Rabies; EIE: Epidemic and endemic typhus; Clo: Clonorchiasis; FE: Forest encephalitis; Syp: Syphilis; NGI: Neisseria gonorrhoeae infection; CIHT: Chlamydia infection of genitourinary tract; Tri: Trichomoniasis; HB: Hepatitis B; HC: Hepatitis C; EBVI: EB virus infection; EI: Enterovirus infection; Tra: Trachoma; NT: Neonatal tetanus; Her: Herpes; AHC: Acute hemorrhagic conjunctivitis
The epidemiological features of imported infections
The spectrum of illnesses varied according to age, travel purpose and source country of these travelers. Respiratory illnesses and gastrointestinal illnesses were more likely to be reported in tourism travelers, vector-borne diseases were more likely to occur in laboring travelers, while mucocutaneous (particularly acute hemorrhagic conjunctivitis and EB virus infection) diseases were more likely to occur in travelers with business purposes (Table S1). There was no gender difference for the infection spectrum.
By pooling the five-year data, an obvious seasonal pattern was shown that the monthly standardized incidence of all 5 types of infection peaked in July (Fig. 1C), and respiratory disease had the highest average incidence rate (245.00 per million) in this month, followed by blood/sex-transmitted disease (95.80 per million), vector-borne disease (40.58 per million), mucocutaneous disease (7.54 per million), gastrointestinal disease (6.67 per million). This trend was remarkably observed for gastrointestinal disease, mucocutaneous disease and vector-borne disease with remarkable monthly difference than other diseases (Fig. 1C).
The source countries and inbound provinces of imported travelers
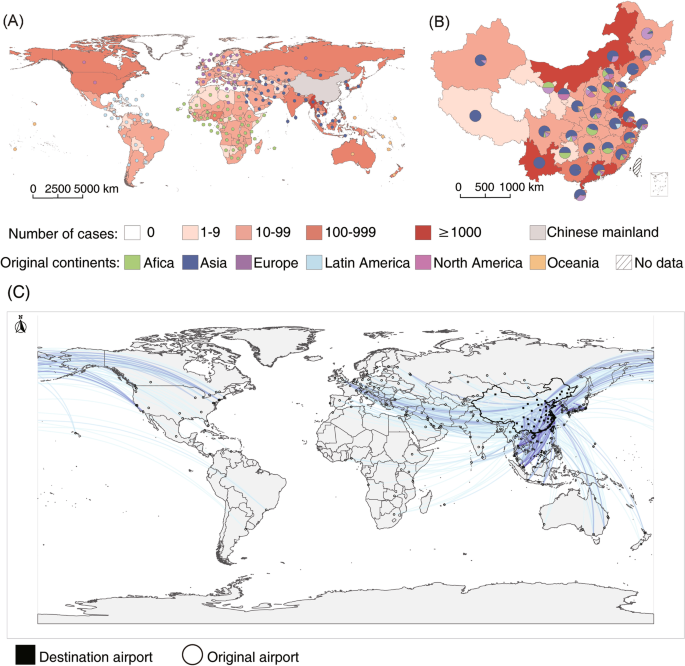
Altogether 17,120 ill travelers had reported their source countries, which were originated from 152 countries on six continents, with their destination distributed in all 31 provinces in the mainland of China (Fig. 4A and B). Asian travelers had taken the predominant part, accounting for 59.02% (10,105/17120) of all imported cases, followed by those from European and African countries. Within Asian countries, Korean travelers had contributed the highest number of cases with RIs, BSTIs and VBDs. The destination provinces which had reported more than 1000 imported cases included Yunnan (3,134 cases), Guangdong (2,017 cases), Shanghai (1,939 cases), Inner Mongolia (1,447 cases) and Jiangsu (1,348 cases).

The originating countries and destiny provinces in China of foreign travelers with imported infections. A Distribution of source countries of imported infections. B The distribution of imported infections in each province of China and the proportion of their original continent. C The distribution map of major international flights and passenger flow entering China from foreign countries or regions
The major international flights and traveler inflow from foreign countries or regions were mapped (Fig. 4C). In 2016, the annual traveler flow from foreign international airports to Chinese airports was about 77.09 million. Among them, the continent with the largest annual inflow number of international flights to China is Asia (62.80 million), followed by North America (5.62 million), Europe (5.60 million), Oceania (1.80 million), Africa (1.00 million), and Latin America (0.27 million). The movement of imported infection followed specific routes (Fig. 4), in that the connections were more frequently seen between African and Hubei, Guizhou and Jiangxi province (13 cases on average per year), and between Asian (mainly including Burma, Vietnam and Laos) and Yunnan province (592 cases on average per year,) and between Asian (Mongolia and Russia) and Inner Mongolia (233 cases on average per year). Notably, the imported patients travelling to metropolises such as Beijing, Shanghai and Guangdong Provinces tended to be multi-continental sources (Fig. 4B and C). The annual travelling data were available from six continents and 23 countries, which were used as denominator for estimation of incidence. This had accounted for 79.25% (111.12/140.21 million person-times) of total travelling population and 45.96% (7,900/17,189) of total imported cases. When related to the source regions, the highest case incidence was reported from the African travelers (296.00 per million), in contrast with the highest case number from Asia, while the lowest incidence was reported from European countries (41.70 per million). When specific diagnosis was compared, both the absolute case number and incidence rate was observed for influenza (Fig. 2).

Comments
Post a Comment